Global Markets – Weekly Review
UPDATED Stock Scan: Strong Setups and Buy Signals *expanding*.
110+ Charts & Commentary on all major Markets — for your weekend reading.
“Don’t start the week without it”
One year ago today, I launched this Substack.
After five years sharing my work freely, then publishing exclusively on Substack for the past year, to now see we’re #26 Finance bestseller…
I’m truly grateful and honored for all your support, and recognition of our hard work.
And mostly through word of mouth too… Thank you for everything.
Onwards and upwards, -MC
KEY TOPICS COVERED
UPDATED STOCKS SCAN:
A pretty great week overall — came in with Buy signals accumulating, and the market responded well (“on schedule”).
Updating potential rally targets: assessing (1) model signals, (2) market response this week, and (3) individual stocks leading.
Many individual Stocks flagged last week were in position to “blow out” of their bottoming structures and lead this rally. Their performance this week, with many watchlist names up +10-20%, was strong confirmation.
In today’s report, we continue scanning for names which can outperform. Overall, still like how key areas of interest are developing.
As before, I’m focused on: Stocks meeting strict criteria for (1) relative strength, (2) improving momentum, (3) defined risk.
We’ll keep building on this extensive list as signals develop.
SPECIAL UPDATE (*continued*): the Dollar & Gold.
*Actionable* & Comprehensive Analysis of Key Market Signals.
Complete list of Buy/Sell setups we’re watching.
Detailed Charts & Commentary: Core Models, Global Equities & Sectors, Volatility, Rates & Credit, Currencies, Commodities, Bitcoin.
A FEW MORE CHARTS ON EXTREME SENTIMENT…
Nearly half of consumers expect stocks to fall:
Similar pessimism led to the market bottoms in 1990, 2003, 2011, and 2020 (sentiment was a contrarian signal).
It also happened in the core decline in 2008 (sentiment was right).
Consumers expecting stocks to stay the same are at an all-time low:
Similar pessimism was seen at the market bottoms in 1990 and 2020.
It also happened in October-November 2008, as stocks began the bottoming phase of the GFC.
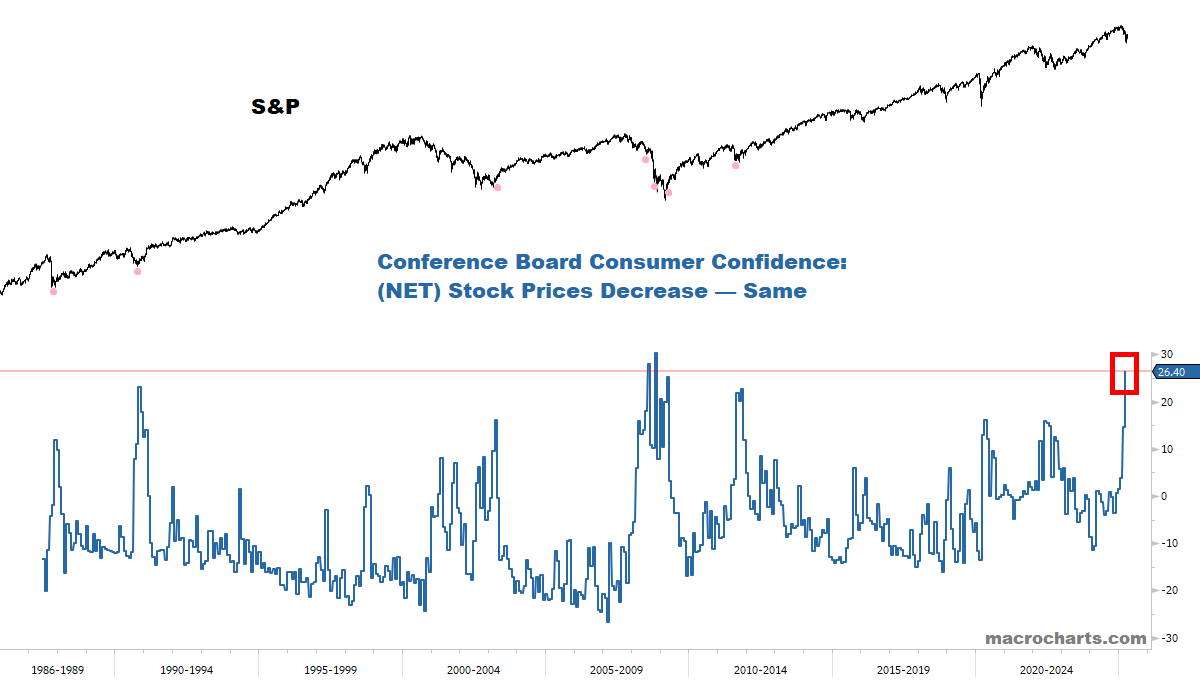
Aggregating the above charts:
This is the second-worst net sentiment in data history (nearly 40 years).
*This monthly survey will be updated on Tuesday April 29, and may be even more extended. (We’ll update the charts in our next post.)
Any way one looks, investor sentiment reflects a significant shock.
One last chart:
The UMich survey (which came out Friday) shows a new record high respondents saying there’s *zero* chance Stocks go up over the next year.
The survey began in 2002, and prior spikes were contrarian signals (2003, 2009, 2023).
Now let’s get to the markets, and main setups I’m watching:
Open Portfolio & Updated Plan
Keep reading with a 7-day free trial
Subscribe to Macro Charts to keep reading this post and get 7 days of free access to the full post archives.


