
Something Incredible is Happening in China
Is it impossible... or inevitable?

Note: I’m publishing this full post without a paywall.
Please feel free to share.
Have a great weekend, -MC
This is an educational study of market history. The patterns described here happened countless times before, and will likely repeat forever.
I hope this serves as a helpful reference for future investors. It explains concepts which I think will remain true well after my time.
INTRODUCTION
This week on social media, I shared what I consider to be one of many critically important charts on Chinese Stocks:
CHART: FXI iShares China Large-Cap ETF, Short Interest %.
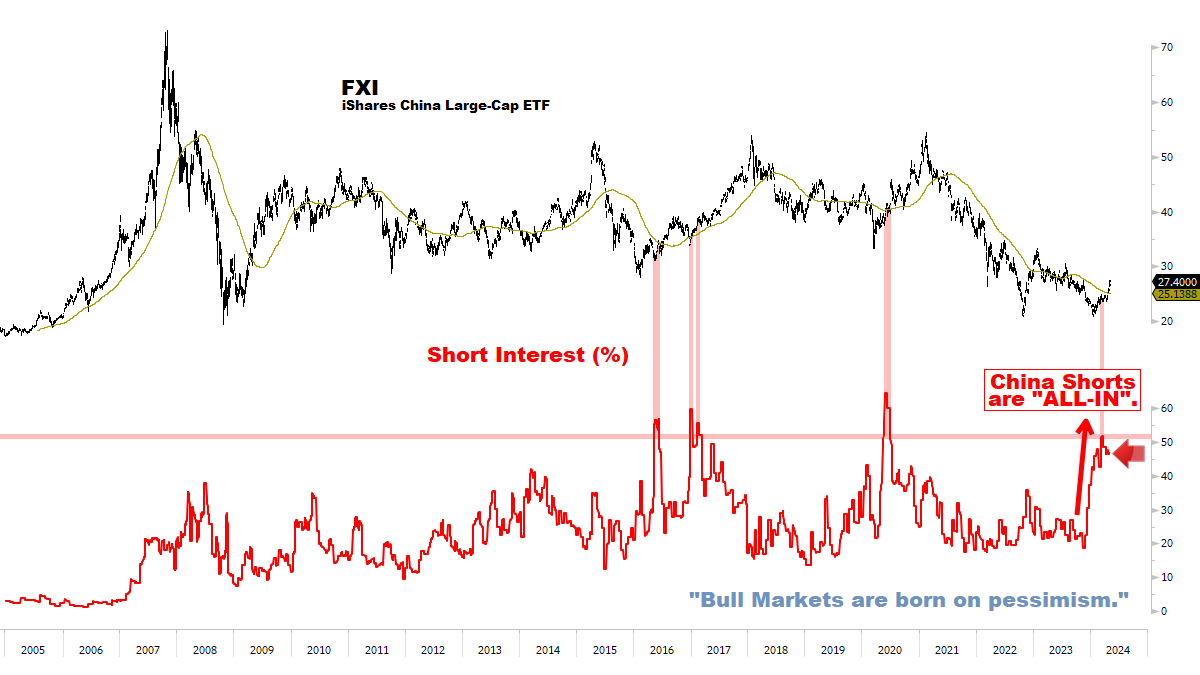
The Short Interest data is from the end of April 2024, and was updated this week. At the time of writing, FXI has gained as much as +8% since the end of April 2024, so the Short Interest probably fell somewhat further, though probably not much.
This chart was shared widely, so I wanted to set the record straight and shed some light on history.
I think something incredible is happening in the Chinese Stock market. Something potentially career-making, maybe even life-changing.
Many signals strongly suggest a NEW Major Bull Market is forming in Chinese Stocks. Its mere possibility has my full attention. I’ve been in the markets almost 30 years. There is nothing more important that identifying the turn of a new Bull Market, and staying invested for as long as it runs.
INVESTMENT THESIS
My view and positioning on China is not recent. I have been (and remain) extremely Bullish on Chinese Stocks since late 2023. Around December 2023 and into January-February 2024, I systematically accumulated positions in my preferred big liquid Chinese Tech Stocks as they reached *horrific* price levels.
No, I did not buy the exact bottom.
Still, for three grueling months everything I saw from the Chinese authorities, CEOs and smart locals told me a major new Bull Market was very close. Meanwhile, the universal view was that China, as a country, was doomed forever. Chinese Stocks were “uninvestable”.
But then something else happened.
The most important signal of all: price made a historic turn.
CHART: On Monday February 19 2024, the Hang Seng Index’s Weekly MACD triggered a Buy signal. At the close of that week on Friday February 23 2024, that signal was confirmed.

It’s worth noting that this Weekly Buy signal came soon after Chinese Stocks retested multiple long-term support levels, while forming a classic double-bottom versus October 2022 (lower horizontal line).
Critically, note how price quickly recovered and formed a tight shelf at the 2011 bottom (upper horizontal line, highlighted in the inset).
This was a classic capitulation followed by an upside price reversal – the first sign of a potential historic turn, and strong hands beginning to accumulate big positions.
CHART: On Wednesday April 1 2024, the Hang Seng Index’s Monthly MACD also triggered a Buy signal. Though it triggered on the first day of the month, the price action in individual Stocks suggested it could be confirmed by the close of April. And it was.
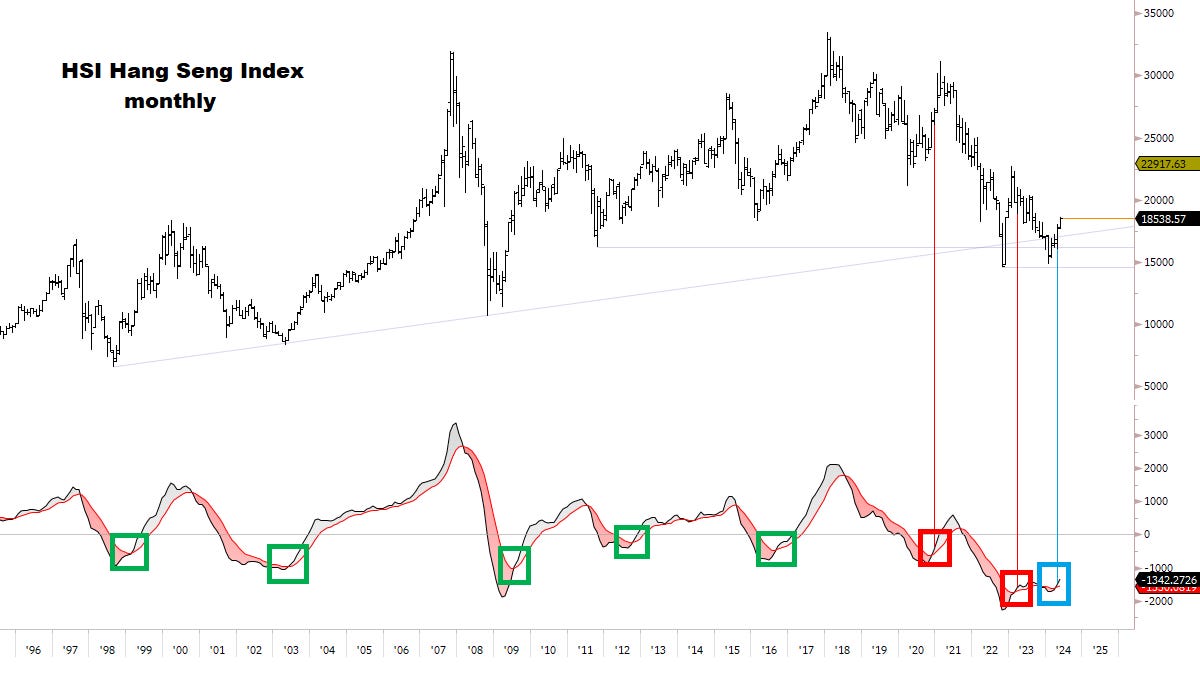
Note this oversold Monthly Buy signal triggered soon after the start of every major Bull Market in HSI history. It was an excellent signal from 1998 to 2016 (five consecutive times).
In December 2020 (red box), it triggered a Buy and briefly extended +14.5% higher, and then turned down. Overall the results were ok if one managed the risk correctly. (Later I’ll show one way I’m managing this.)
In March 2023, it triggered a Buy which led to the only failure in the history of this market. Nevertheless, risk management avoided most of the damage.
Ultimately, the March 2023 Buy signal failed because the fundamental and technical conditions were not fully in place for a new Bull Market to form.
One important reason it failed: investors weren’t pessimistic enough.
Related to this, in January 2023 I warned that the extremely Bullish consensus on China was likely to be wrong. I shared the chart below with some concern. I also overrode the Buy signal and decided to stay out.
*No, I didn’t go Short at the time (I rarely Short markets with strong positive momentum, but that’s a post for another day). In hindsight maybe I should have gone Short… the top in China was two trading days later. The top in EEM was four trading days later.

Overall throughout history, when conditions came together for a Major Bull Market advance in China, patient investors were rewarded with excellent returns.
I believe those conditions are firmly in place today:
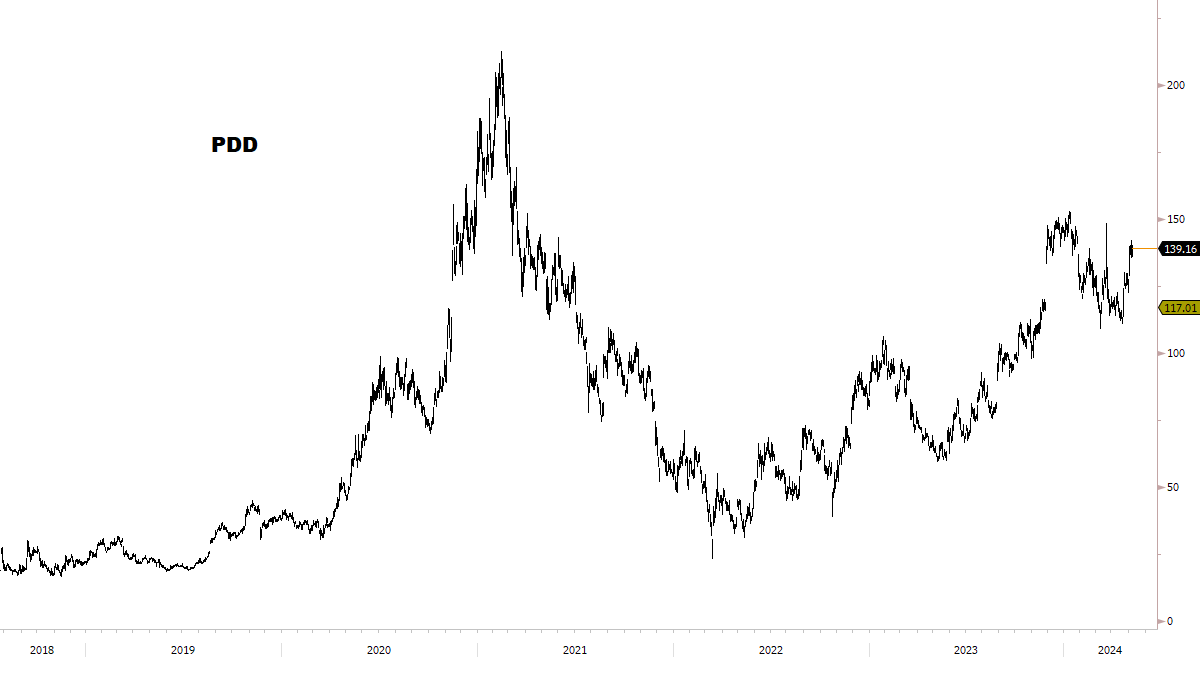
KEY STOCKS IN STARTING POSITION
A number of important Stocks were gradually stabilizing over the last several months and some were even in uptrends, increasing my conviction that an important turn could be underway.
For example:


VALUATION
Depressed valuations are the fuel that ignites the enormous returns seen in primary Bull Markets.
Chinese Stocks were *and still are* off-the charts-dirt-cheap.
I shared this on Substack soon after starting my publication in April:
CHART: BABA Free Cash Flow Yield (%)

Data source: Bloomberg.
Depending on how you calculate it, BABA’s FCF Yield reached almost 15-25% earlier this year.
Conversely, BABA’s FCF Yield was 3% at the major Tops in 2018 and 2020. That’s where it became too expensive. Think of where BABA could be trading someday, in order to get that expensive again. And factor the additional operating growth as long as China isn’t doomed… instead recovering gradually for a while.
Here are a couple more examples:


Great things tend to happen to Stock prices when companies generate mountains of cash and are incentivized to return it to shareholders via dividends and buybacks.
This shareholder-friendly environment has been underway in China for months now, but no one noticed. Everyone loves a Bull Market… except this one apparently.
But hopefully the genie is out of the bottle now.
History does indeed rhyme.
And now I’m reminiscing on how another big Bull Market got started…
THE ENERGY BULL MARKET OF 2020-2022
CHART: OXY Free Cash Flow Yield %

Remember a time not so long ago, when Oil traded at negative prices, Energy was “uninvestable” in a work-from-home world, bikes with ipads were all the rage, and grandmaster Buffett went all-in on Occidental Petroleum (OXY)?
Buffett built a monster position at FCF Yields of roughly 15-20%. OXY gained +1,000% in the 2 years after it bottomed. Buffett kept buying all the way up.
Those same FCF Yields are available in high-quality China names today.
In 2020-2022, all of a sudden the Energy sector had embraced capital discipline, buybacks and dividends flowed, and everything changed.
Isn’t this also true in China today?
HISTORICAL CHART STUDIES
Slow and steady, the data continues to confirm a new China Bull Market is underway.
Recently, HSI triggered a 10-day Breadth Thrust of 3:1. This overwhelming strength is a core feature of new Bull Markets. Jason Goepfert wrote, “Every time that's happened since 1997, it ended a bear market.”

Let’s go back and review the Monthly Buy signals:
Now let’s study those big Bull Markets (1999, 2003, 2009, 2012, 2016):
Focusing first on:
Those which began with Monthly Buy signals.
AND were later confirmed with Breadth Thrusts as powerful as the one today.
History reveals a fascinating and remarkably consistent pattern:

Let’s look at those periods individually:
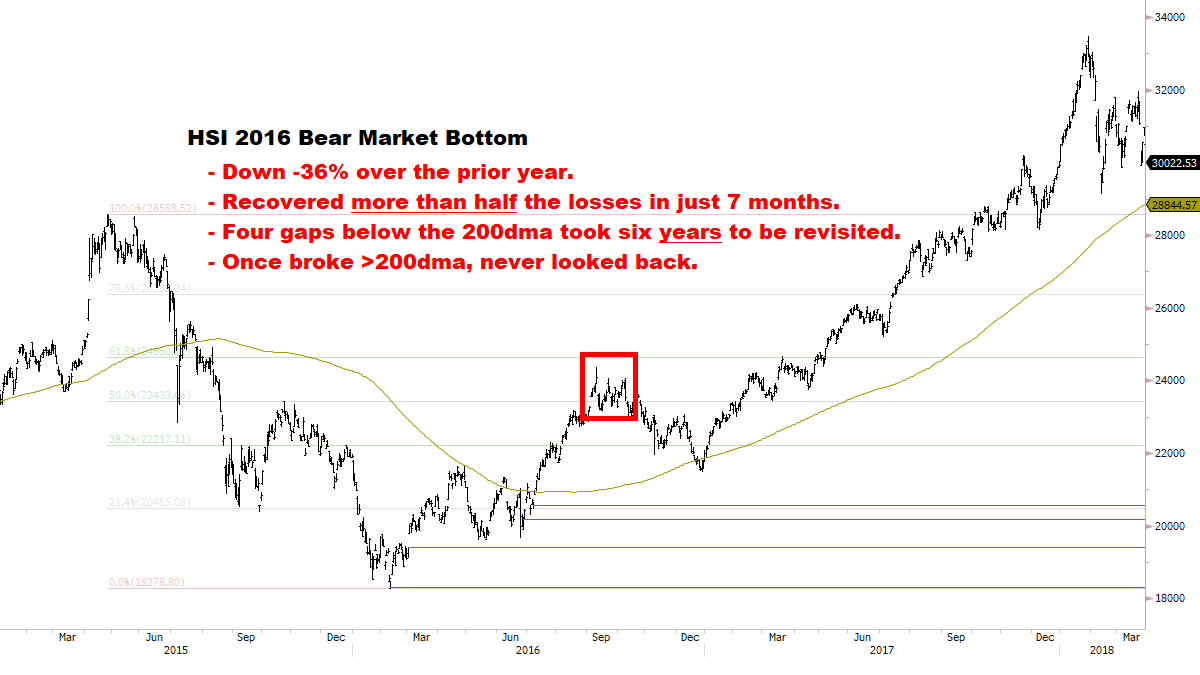


Note how linear the rallies were, especially once they broke above their respective 200dmas.
The trend was in full force.
Now let’s add the two other Major Bottoms (no charts included, commentary-only):
Although we excluded 1999 and 2011-2012 from the Chart Studies (they didn’t trigger a Breadth Thrust), those rallies still showed the same consistent behavior.
The 1999 Bear Market Bottom came after a -61% decline over the prior year. It recovered more than half the losses in just 8 months and went on to even higher levels the following year.
The 2011 Bear Market Bottom came after a -35% decline over the prior year. It recovered more than half the losses in less than 5 months and went on to even higher levels the following year.
Next, we look at a “Golden Cross”: when the 50dma crosses above the 200dma.
Look at what happened in those three big turns:
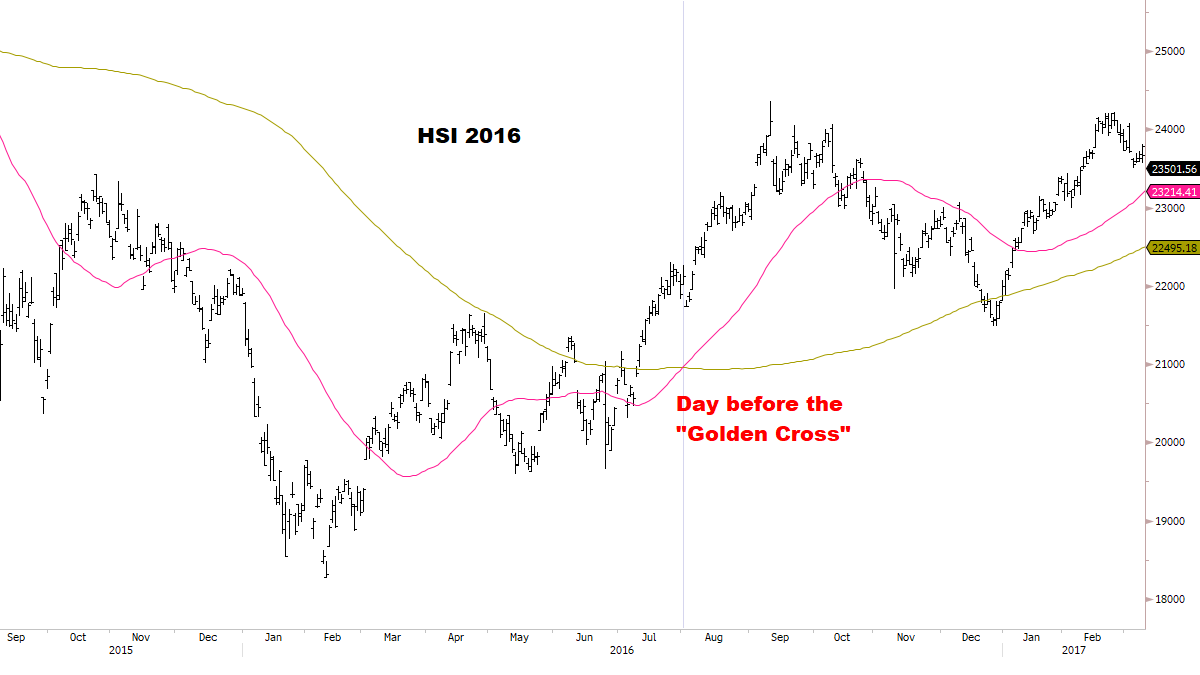
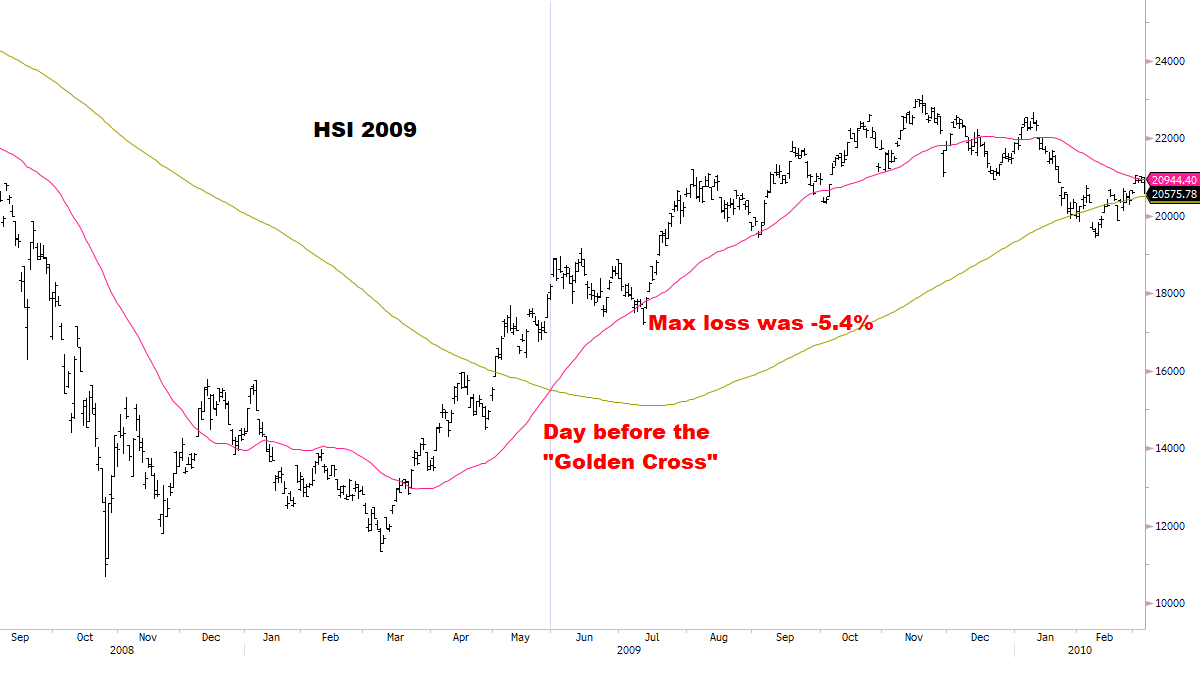

The Golden Cross was another clue of what was already happening for months – a new Bull Market that barely looked back once it began.
PUTTING IT ALL TOGETHER
Incredibly, every new China Bull Market exhibited remarkably consistent initial behavior. The market recovered more than half its prior Bear Market losses in less than a year, with almost no pullback after the Bull trend was confirmed.
Let’s look at what’s going on today:
As a lifelong student of markets, I find this to be absolutely fascinating.

IF HISTORY IS CORRECT:
A repeat of the historical pattern (which was consistent in all cases), would target HSI Index at 23-25k BEFORE year-end 2024.
That’s an *additional* +24% to +35% upside from current levels.
This would make China probably one of the best performing markets in the world this year, by far. No one thinks these targets are remotely possible. And yet, history shows this is precisely what happened.
And this is at the INDEX level… imagine what the leading Stocks could gain in this scenario. Some could advance multiples more.
History also strongly suggests that despite the market being stretched short-term, there may be NO significant pullback or correction from these levels.
This was especially true in the cases where Breadth was overwhelmingly strong, which is exactly what we see today. Strength led to more strength.
Take another look at the [red box] in the previous chart.
It looks impossible, right?
But history says otherwise: these patterns happened countless times in markets, and will likely repeat forever.
Let’s revisit the Energy Bull Market of 2020-2022 for a moment:

XLE triggered Weekly and Monthly Buys on November 2020 and January 2021 respectively (not shown).
Two gaps under the 200dma remain unfilled to this day.
Once it broke the 200dma and the Golden Cross triggered, it never looked back.
Staying with the 50dma until it turned DOWN, and getting back Long when it turned back UP, kept you in for most of the ride.
XLE fell -71% over the preceding 2 years, bottomed and recovered more than half of the losses in one year. Most of the initial recovery occurred in the 5 months after the double-bottom completed (similar to where China may be now).
XLE eventually tripled in less than two years.
I remember the turn in XLE like it was yesterday. I had a fairly big exposure, and was waiting for a pullback ideally to the 200dma to max out. But the market had other plans, Buys triggered after a minor pullback and I had to react. At the time, I was sharing Energy charts on Twitter, including some historical upside scenarios which seemed impossible. Eventually XLE blew past them all. Such is the power of a Bull Market.
In hindsight, it wasn’t until big investors like David Tepper (whom I’ve never met but has long been an inspiration to me) went on TV sometime in late Q1 2021 and said he liked Energy and OXY… that the conversation changed. It was my top position, and it turns out we had been buying it at roughly the same time. In Q1 2021 it was still very contrarian to go on TV and say you liked Energy. Even after the enormous initial rally and all signs of a new Bull Market being underway, it was still considered too risky. But David Tepper went on the record, and the rest is history.
The same setup is likely happening today in China.
Maybe it will take a big investor disclosing Longs to help change the narrative. Who knows. To my knowledge this hasn’t happened yet.
PSYCHOLOGY
Meanwhile, are you waiting for a pullback with a plan to Buy/Add your favorite China names at better prices? The rally seems a bit stretched here… it’s gone too far too fast… so maybe reducing exposure to your winners in the hopes of Buying them back at lower prices could work?
Note to self: history says that the voice inside your head asking all those questions is the Bull trying to throw you off.
As I wrote before, there is nothing more important that identifying the turn of a new Bull Market, and staying invested for as long as it runs.
How do you do that?
One option:
Look back at the Golden Cross charts and see how the 50dma carried all the way UP to the Top, and when it finally turned DOWN, gave an excellent warning that something had changed. You could have sold the first close below the 50dma, or when it turned down, or a combination of both.
There are infinite variations of moving average rules one could test to optimize the holding strategy. You may have different objectives, holding periods or risk tolerance. The 50dma is a simple, easy starting point... the main concept is there. Feel free to play around with it and if you find something better, let me know.
Remember the #1 Rule of a Bull Market: it won’t let you ride it.
This could be a textbook advance, keeping everyone underinvested, waiting for the pullback that never comes, chasing rips and squeezing Shorts relentlessly.
*Remember how linear all those historical rallies were.
What’s the most contrarian view on China for the near future? That this thing continues charging incessantly higher, not letting anyone ride it. And eventually when it becomes the lead Bull with everyone cheering it on, maybe around U.S. election time, then a multi-month correction back to the 200dma becomes a real possibility, with momentum finally confirming a turn down. No one will care because it was a blowout year. But again, that’s how the history played out.
Paradoxically, the most contrarian China trade now is to be a trend-follower.
This idea may have been the reason why I finally started publishing on Substack in late April, after sharing my best ideas freely on Twitter for more than five years.
If history is right, and if we are right to study and learn from it, then China could turn EM managers into the new rock stars by year-end. Good for them. They went through hard times for a while, and maybe now they’ll get their place in the sun.
I hope this serves as a useful reference for posterity. I’m open-minded that this could really work. If it doesn’t, my rules will get me out, adjusting positions and risk exposure accordingly.
This will all look obvious in hindsight either way, though as I write today, few investors think it’s going much higher, if at all.
“It’s a Bull Market you know”.
It may look impossible today. But someday, it may look like it was inevitable all along.
If you liked this post, please spread the word and subscribe below.
*I post 50-70 times a year for paid subscribers, and 3-4 times a year for free distribution. Focus as always on big trends & ideas, historical analysis, strategy and execution.
Thanks for reading.
I agree, China risk/reward looks great. Reminds me a lot of energy late 2020 too.
Gold miners look like they are in a similar spot too, after performing poorly for so long.
This gives very good macro/political background. Don't know if you can read it without a sub.
https://geopoliticalfutures.com/china-signals-economic-policy-changes/